Autochartist General
MARKET ANALYSIS

Emerging Triangle pattern in its final wave was identified on the NGC/USD 4 hour chart. After a strong bullish run, we find NGC/USD heading towards the upper triangle line with a possible resistance at 3.1484. If the resistance shows to hold, the Triangle pattern suggests a rebound back towards current levels.
XAUUSD has broken through the resistance line which it has tested twice in the past. We have seen it retrace

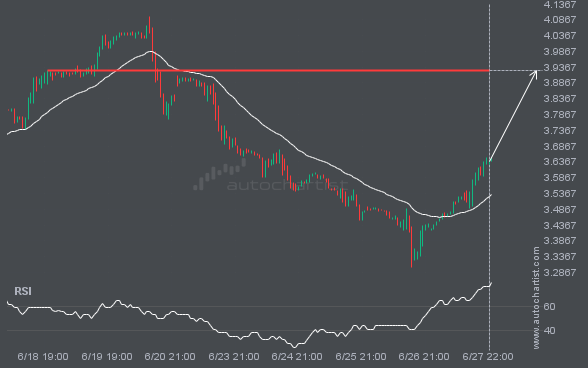
NGC/USD is moving towards a resistance line. Because we have seen it retrace from this line before, we could see

The breakout of BRN/USD through the 72.6370 price line is a breach of an important psychological price that is has

S&P500 moved through the support line of a Rising Wedge at 6002.303124999999 on the 4 hour chart. This line has

You would be well advised to confirm the breakout that has just occurred – do you believe the move through

The movement of XAUUSD towards 2617.9399 price line is yet another test of the line it reached numerous times in