MARKET ANALYSIS

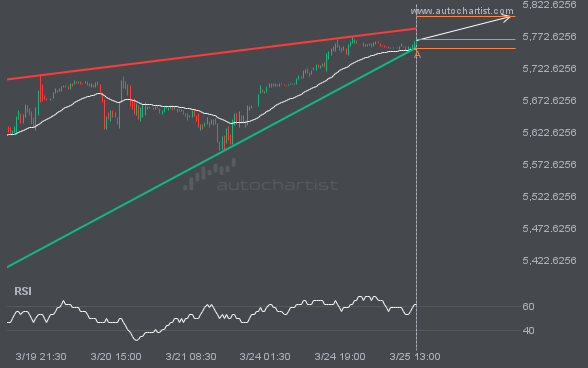
S&P500 was identified at around 5766.8 having recently rebounded of the support on the 30 Minutes data interval. Ultimately, the price action of the stock has formed a Rising Wedge pattern. This squeeze may increases the chances of a strong breakout. The projected movement will potentially take the price to around the 5803.0782 level.

FTSE100 is approaching a support line at 10138.6699. If it hits the support line, it may break through this level to continue the bearish trend, or it may return to current levels.

NGC/USD recorded an exceptional 10.43% move over the last 18 hours. Whether you follow trends or look for reversals, this move is hard to ignore.

S&P500 has broken through 6946.9600, which it has tested many times before. We have also seen it retrace from this level. If this new trend persists, S&P500 may be heading towards 6822.6382 within the next 3 days.

The price of XAUUSD is heading toward 4833.3403. Despite the recent breakout through 5066.8848, it may struggle to gain momentum to reach the forecast price and could move back in the other direction. This has happened many times in the past, so watch for a possible bounce back.

A breakout of EURUSD through the support line of a Triangle could signal what’s ahead. If the breakout persists, we may see EURUSD’s price test 1.1842 within the next 2 days.

An emerging Rising Wedge pattern in its final wave has been identified on the FTSE100 4 hour chart. After a strong bearish run, FTSE100 is heading toward the upper triangle trendline, with possible resistance at 10110.2750. If the support holds, the Rising Wedge pattern suggests a rebound toward current levels.

USDJPY is approaching a resistance line at 153.4405. If it hits the resistance line, it may break through this level to continue the bullish trend, or it may return to current levels.