MARKET ANALYSIS

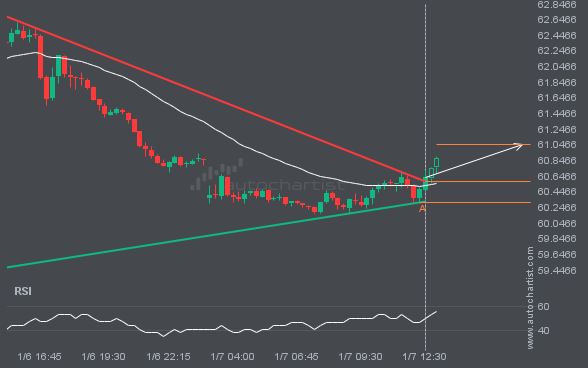
BRN/USD has moved through the resistance line of a Triangle pattern at 60.57892063492063 on the 15 Minutes chart. This line has been tested multiple times in the past, and this breakout could signal an upcoming change in the current trend. Price may continue in the current direction toward 61.0576.

EURUSD is approaching a critical level that could be a key deciding factor for what comes next. We may see this trajectory continue to test and break through 1.1791, unless it loses momentum and pulls back to current levels.

XAUUSD is moving toward a resistance line. Since it has retraced from this line before, we may see either a breakout through this line or a rebound to current levels. It has touched this line numerous times in the last 19 hours and may test it again within the next 6 hours.

LTCUSD is approaching a support line at 54.8600. If it hits the support line, it may break through this level to continue the bearish trend, or it may return to current levels.

FTSE100 has broken through the resistance line of a Falling Wedge technical chart pattern. Because it has retraced from this line in the past, you should wait for confirmation of the breakout before taking any action. It has touched this line twice in the last 21 days, which suggests a possible target around 10543.0275 within […]

The movement of XAGUSD toward the resistance line of a Ascending Triangle is yet another test of the line it has reached numerous times in the past. This test of the line could occur within the next 5 hours, but it is uncertain whether it will result in a breakout through this line or simply […]

EURUSD is moving toward a resistance line. Since it has retraced from this line before, we may see either a breakout through this line or a rebound to current levels. It has touched this line numerous times in the last 13 days and may test it again within the next 3 days.