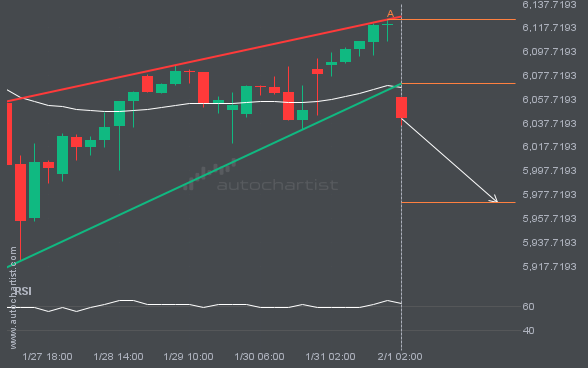
The last 8 4 hour candles on S&P500 formed a Pennant pattern and broken out through the pattern lines, indicating a possible bearish movement towards the price level of 5971.3683.
 Skip to content
 The last 8 4 hour candles on S&P500 formed a Pennant pattern and broken out through the pattern lines, indicating a possible bearish movement towards the price level of 5971.3683.
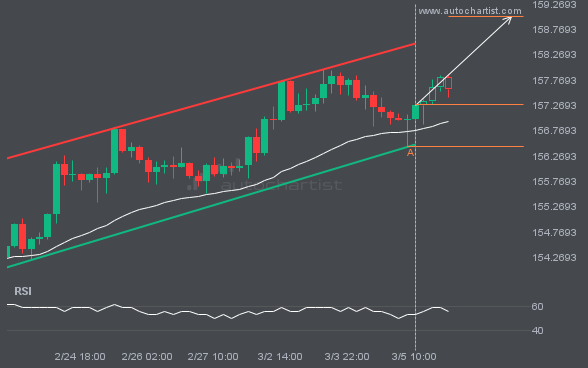
USDJPY is heading toward the resistance line of a Channel Up pattern and could reach it within the next 2 days. It has tested this line numerous times before, and this time may be no different, ending in a rebound instead of a breakout. If a breakout doesn’t occur, we could see a retracement back […]
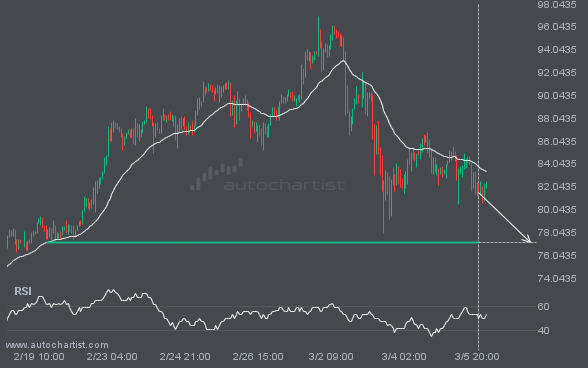
XAGUSD is moving toward a key support level at 77.1916. This level has been tested before for XAGUSD. This may present a good trading opportunity either at the spot price or after a breakout through this level.
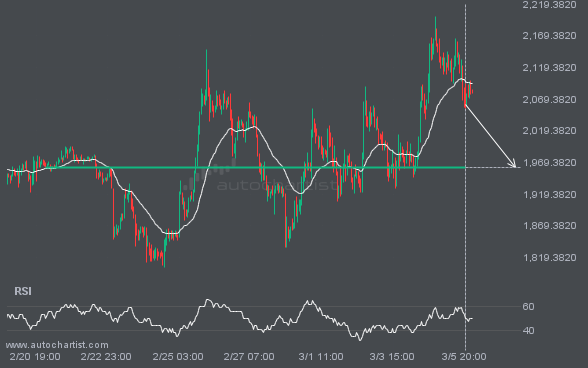
ETHUSD is heading toward 1960.8500 and could reach this level within the next 3 days. It has tested this level numerous times in the past, and this time could be no different, ending in a rebound rather than a breakout. If a breakout does not occur, we may see a retracement back to current levels.
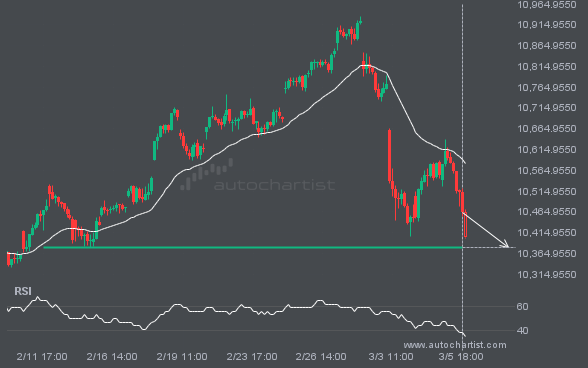
FTSE100 is heading toward 10378.5498 and could reach this level within the next 2 days. It has tested this level numerous times in the past, and this time could be no different, ending in a rebound rather than a breakout. If a breakout does not occur, we may see a retracement back to current levels.
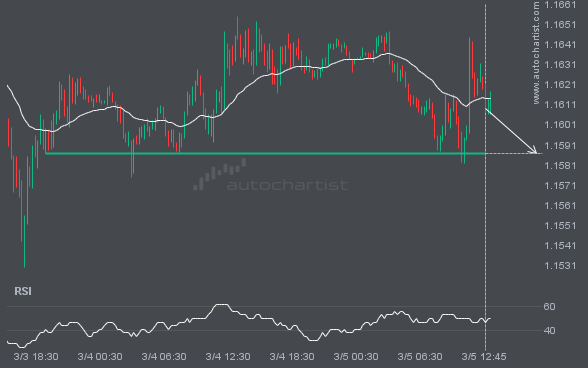
EURUSD is approaching a critical level that could be a key deciding factor for what comes next. We may see this trajectory continue to test and break through 1.1587, unless it loses momentum and pulls back to current levels.
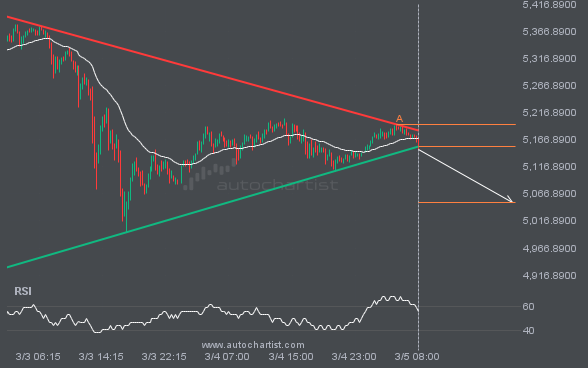
XAUUSD has broken through the support line of a Triangle pattern and suggests a possible move to 5051.3372 within the next 16 hours. It has tested this line before, so it is prudent to wait for confirmation of the breakout before taking action. If the breakout is not confirmed, we could see a retracement back […]
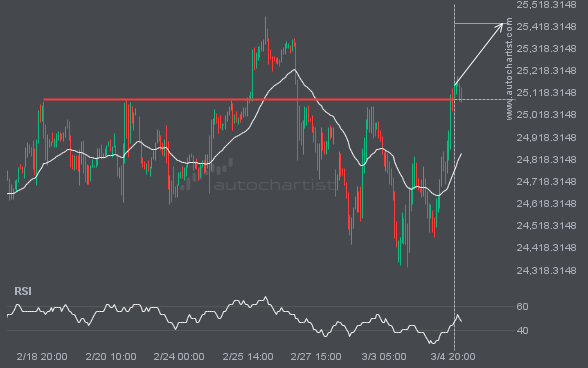
A strong resistance level has been breached at 25087.2480 on the 1 hour NAS100 chart. Technical analysis forecasts a move to 25431.5938 within the next 2 days.