Autochartist General
MARKET ANALYSIS

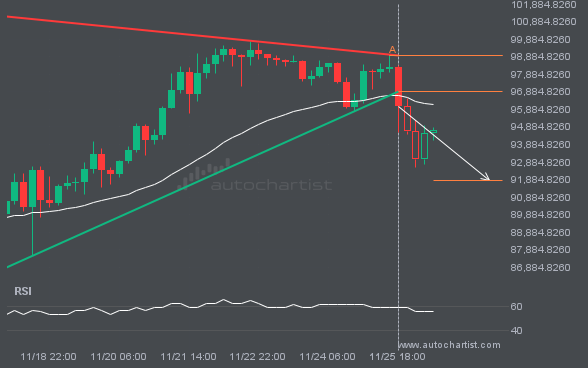
BTCUSD has broken through a support line of a Triangle chart pattern. If this breakout holds true, we may see the price of BTCUSD testing 91859.7067 within the next 2 days. But don’t be so quick to trade, it has tested this line in the past, so you should confirm the breakout before taking any action.
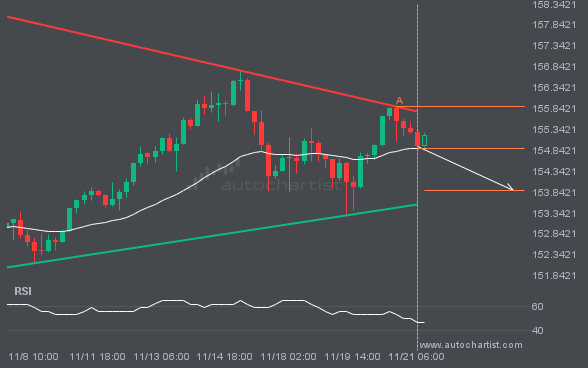
An emerging Triangle has been detected on USDJPY on the 4 hour chart. There is a possible move towards 153.8857

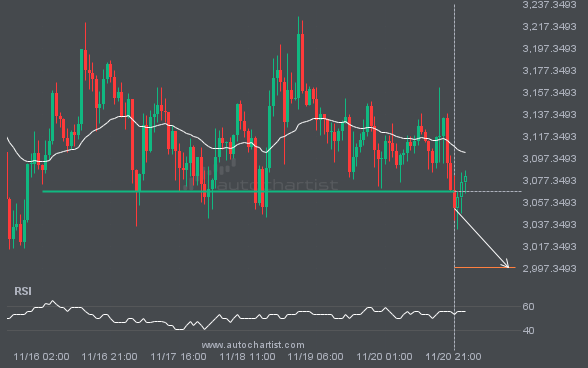
The breakout of ETHUSD through the 3067.3601 price line is a breach of an important psychological price that is has

FTSE100 is heading towards 8148.8799 and could reach this point within the next 3 days. It has tested this line

NGC/USD experienced an extremely large move that lasted 2. This movement is in the 95.0 percentile and is uncommon. It

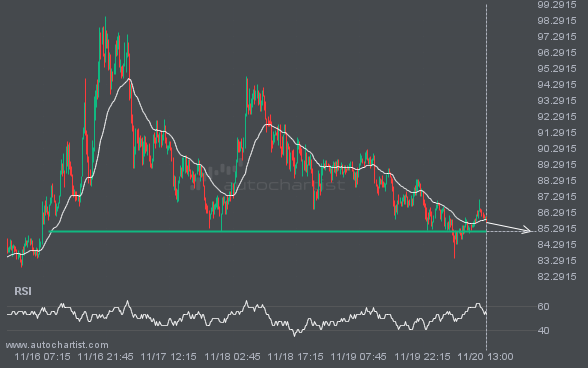
A strong support level has been identified at 85.1100 on the 15 Minutes LTCUSD chart. LTCUSD is likely to test

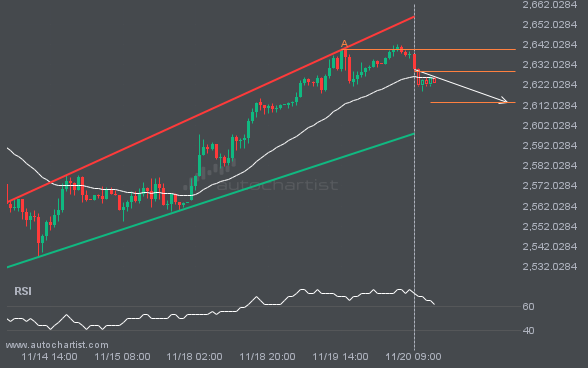
XAUUSD is heading towards the support line of a Channel Up and could reach this point within the next 2

EURUSD is moving towards a key support level at 1.0523. This is a previously tested level for EURUSD. This could