Skip to content
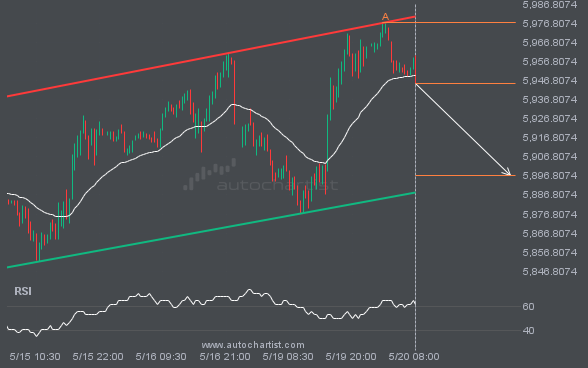
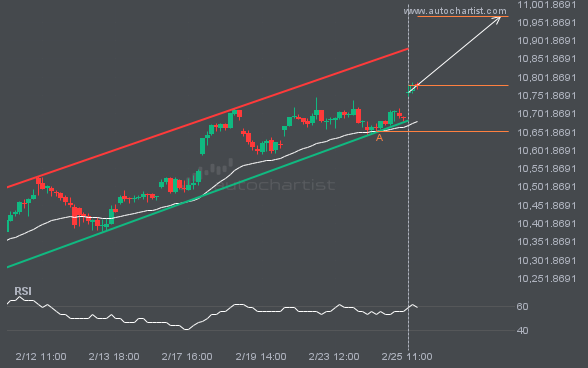
 S&P500 was identified at around 5944.95 having recently rebounded of the resistance on the 30 Minutes data interval. Ultimately, the price action of the stock has formed a Channel Up pattern. This squeeze may increases the chances of a strong breakout. The projected movement will potentially take the price to around the 5897.1179 level.