Skip to content
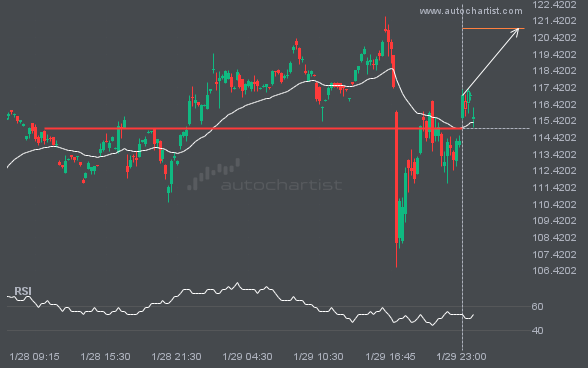
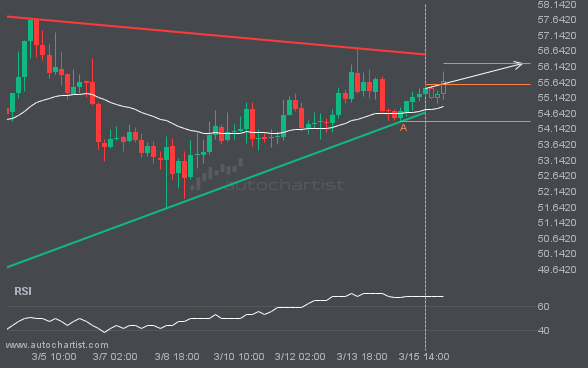
 XAGUSD has broken through a resistance line. Because it has previously retraced from this price, you should wait for confirmation of the breakout before trading. It has touched this line multiple times over the past 2 days, which suggests a possible target around 120.9679 within the next 8 hours.