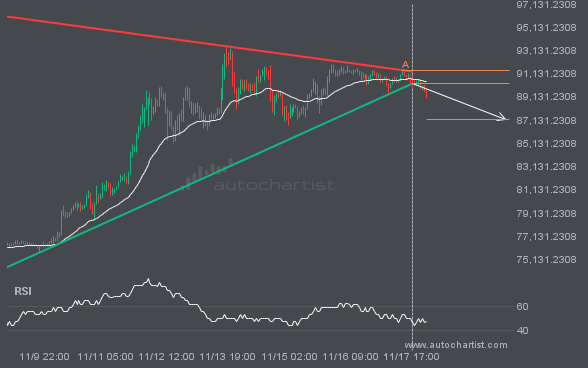
The last 12 1 hour candles on BTCUSD formed a Triangle pattern and broken out through the pattern lines, indicating a possible bearish movement towards the price level of 87226.9147.
 Skip to content
 The last 12 1 hour candles on BTCUSD formed a Triangle pattern and broken out through the pattern lines, indicating a possible bearish movement towards the price level of 87226.9147.
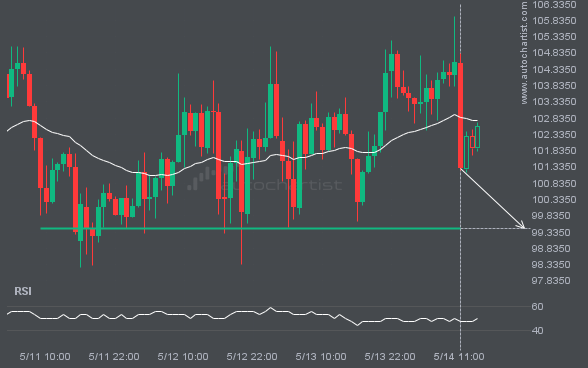
The price of LTCUSD in heading back to the support area. It is possible that it will struggle to break through it and move back in the other direction. The price may eventually break through, but typically the price retreats from the level a number of times before doing so.
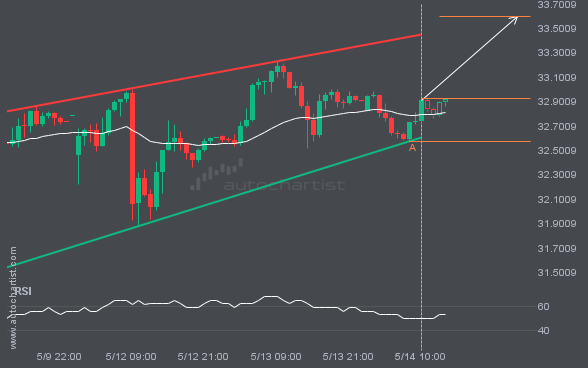
Emerging Rising Wedge pattern in its final wave was identified on the XAGUSD 1 hour chart. After a strong bullish run, we find XAGUSD heading towards the upper triangle line with a possible resistance at 33.5981. If the resistance shows to hold, the Rising Wedge pattern suggests a rebound back towards current levels.
FTSE100 is approaching the resistance line of a Ascending Triangle. It has touched this line numerous times in the last 7 days. If it tests this line again, it should do so in the next 9 hours.
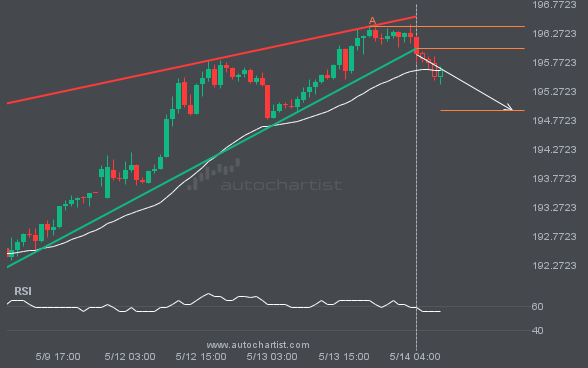
The last 6 1 hour candles on GBPJPY formed a Rising Wedge pattern and broken out through the pattern lines, indicating a possible bearish movement towards the price level of 194.9349.
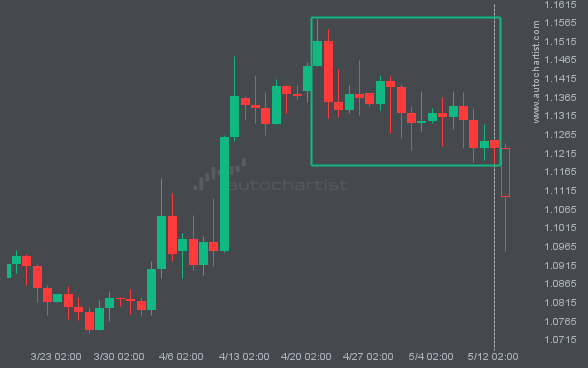
EURUSD hits 1.12281 after a 2.49% move spanning 22 days.
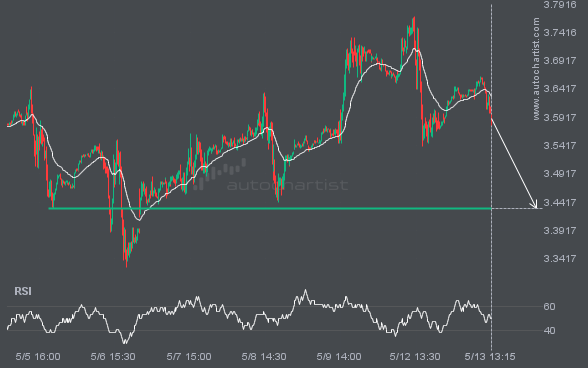
The price of NGC/USD in heading back to the support area. It is possible that it will struggle to break through it and move back in the other direction. The price may eventually break through, but typically the price retreats from the level a number of times before doing so.
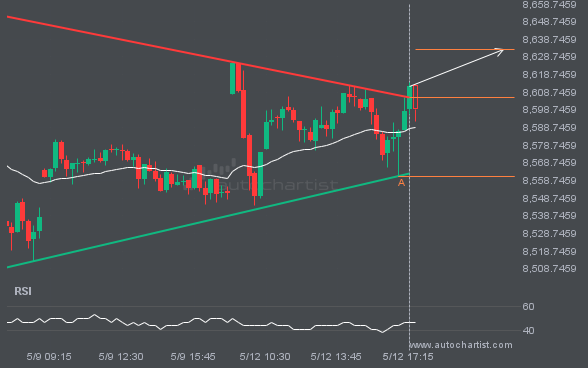
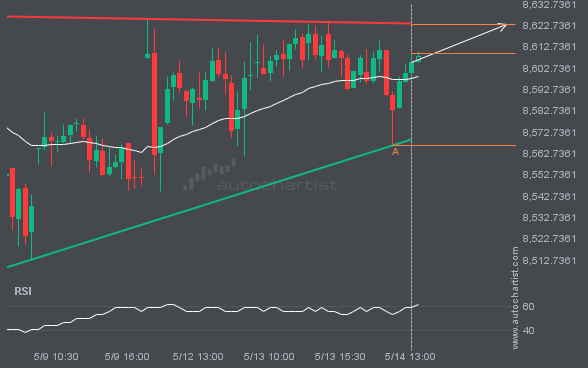
FTSE100 has broken through a resistance line. It has touched this line at least twice in the last 5 days. This breakout may indicate a potential move to 8633.2325 within the next 5 hours. Because we have seen it retrace from this position in the past, one should wait for confirmation of the breakout before […]