...
MARKET ANALYSIS

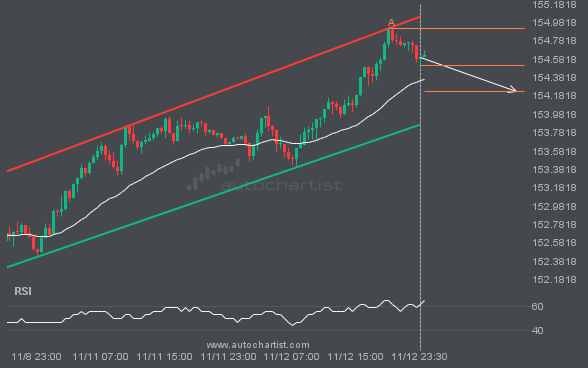
USDJPY is moving towards a support line. Because we have seen it retrace from this line before, we could see either a break through this line, or a rebound back to current levels. It has touched this line numerous times in the last 6 days and may test it again within the next 15 hours.

S&P500 is approaching the line at 6727.1401. If this move continues, the price of S&P500 could test 6727.1401 within the next 9 hours. But do not rush to trade. It has tested this line many times in the past, so the move could be short-lived and end in a rebound.

An emerging Triangle pattern in its final wave has been identified on the XAUUSD 15 Minutes chart. After a strong bearish run, XAUUSD is heading toward the upper triangle trendline, with possible resistance at 4062.2516. If the support holds, the Triangle pattern suggests a rebound toward current levels.

An emerging Channel Down pattern in its final wave has been identified on the BRN/USD 4 hour chart. After a strong bearish run, BRN/USD is heading toward the upper triangle trendline, with possible resistance at 62.0886. If the support holds, the Channel Down pattern suggests a rebound toward current levels.

USDJPY is moving toward a resistance line. Since it has retraced from this line before, we may see either a breakout through it or a rebound to current levels. It has touched this line multiple times in the past 10 days and may test it again within the next 3 days.

NGC/USD was identified around 4.4165 after recently rebounding off the support on the 4 hour interval. Ultimately, the stock’s price action has formed a Channel Up pattern. This squeeze may increase the chances of a strong breakout. The projected move could take the price to around 4.6835.

LTCUSD has broken through the support line of a Triangle technical chart pattern. Because it has retraced from this line in the past, you should wait for confirmation of the breakout before taking any action. It has touched this line twice in the last 12 days, which suggests a possible target around 89.0247 within the […]

XAUUSD is moving toward a resistance line it has tested many times. It has retraced from this line before, so it’s unclear whether it will break through or rebound again. If XAUUSD continues on its current trajectory, it could reach 4307.5415 within the next 22 hours.