Autochartist Reaches New Broker Integration Milestone
Our analysis tools are now available across more trading platforms than ever, bringing automated market intelligence to more traders worldwide.
Read more →Autochartist trading software consists of an extensive analytics toolset with features to take your trading to the next level. Empower your day-to-day trading decisions with user-friendly trading tools and charting software. Enjoy an unrivalled breadth and depth of analysis driven by advanced algorithms and powerful big-data technology.
Get started for free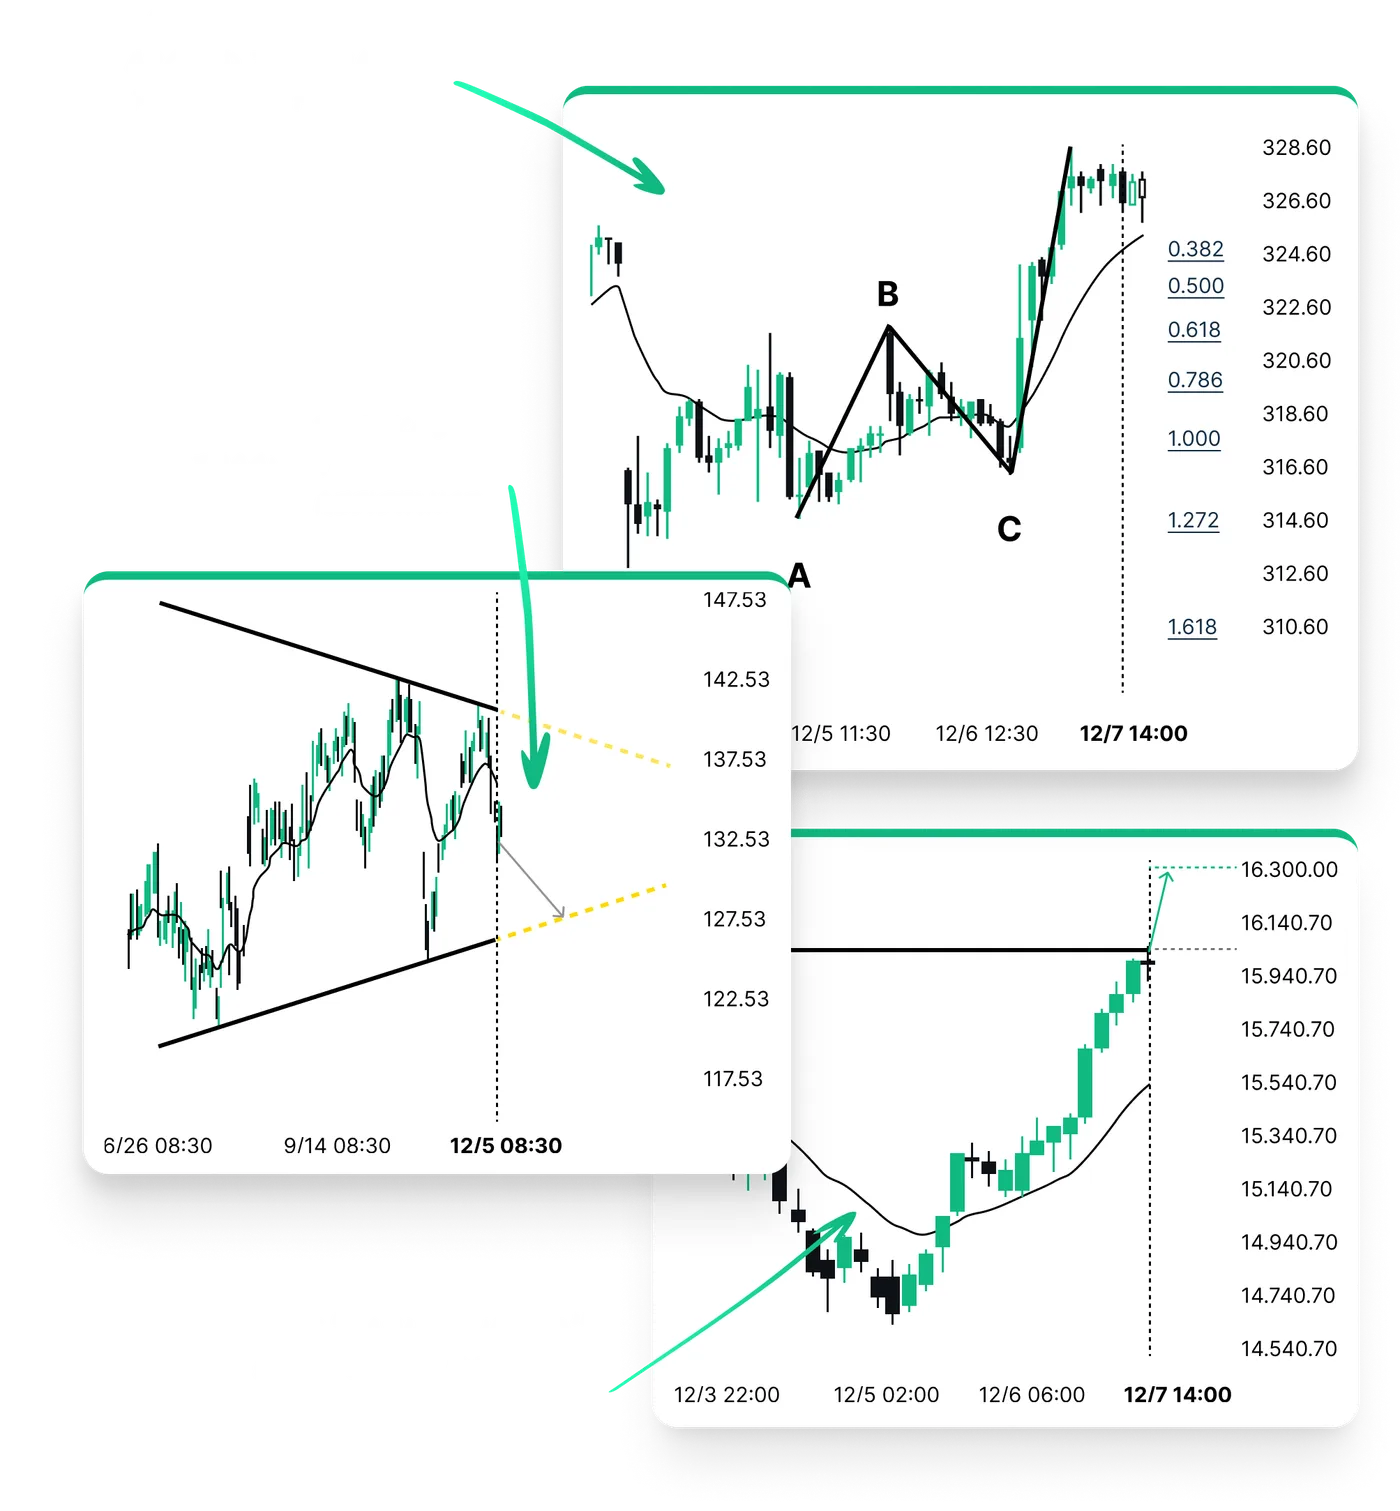
Make informed trading decisions with the trusted leader in automated, data-driven, unbiased market analysis.
Professional analysts can monitor a dozen instruments per day. Autochartist trading applications monitor tens of thousands of financial instruments in real-time.
Never miss a trading opportunity with personalised alerts for market movements, volatility, and upcoming macroeconomic events.
Effectively manage risk and potential overexposure in leveraged markets with Autochartist’s innovative Risk Calculator.
Autochartist signals provide broad coverage of global markets, including stocks, indices, currencies, bullion, metals, commodities, ETFs, options, and cryptocurrencies.
Explore articles on trading, financial markets and interesting trends.
Our analysis tools are now available across more trading platforms than ever, bringing automated market intelligence to more traders worldwide.
Read more →Why disciplined, signal-driven trading beats reacting to every headline — and how automated analysis keeps you consistent.
Read more →NGC/USD has broken through a level at 2.5535, suggesting a possible move to 2.4575 within the next 3 days. It has tested this level numerous times in the past, so you should wait for confirmation.
Read more →