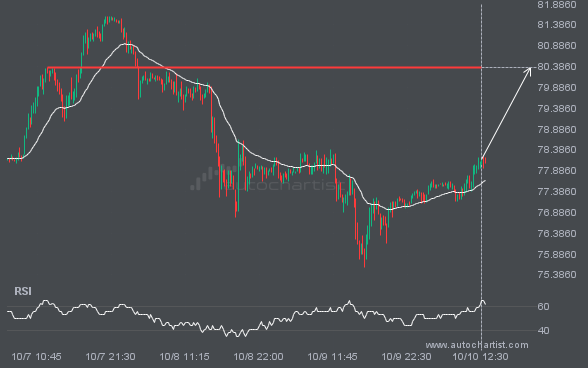
BRN/USD is approaching a resistance line at 80.3550. If it hits the resistance line, it may break through this level to continue the bullish trend, or it may turn around back to current levels.
 Skip to content
 BRN/USD is approaching a resistance line at 80.3550. If it hits the resistance line, it may break through this level to continue the bullish trend, or it may turn around back to current levels.

XAGUSD was identified at around 29.899 having recently rebounded of the support on the 15 Minutes data interval. Ultimately, the price action of the stock has formed a Rising Wedge pattern. This squeeze may increases the chances of a strong breakout. The projected movement will potentially take the price to around the 30.1146 level.
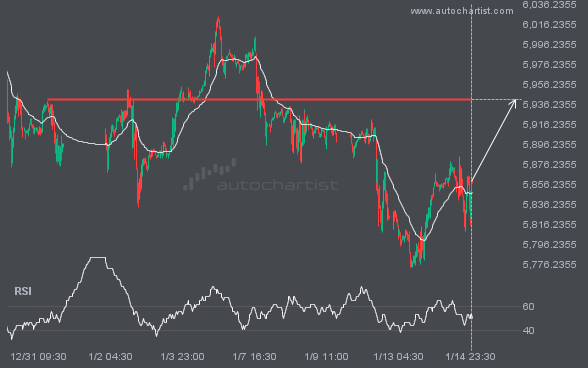
S&P500 is moving towards a line of 5941.1201 which it has tested numerous times in the past. We have seen it retrace from this position in the past, so at this stage it isn’t clear whether it will breach this price or rebound as it did before. If S&P500 continues in its current trajectory, we […]

USDJPY is heading towards 158.4470 and could reach this point within the next 2 days. It has tested this line numerous times in the past, and this time could be no different, ending in a rebound instead of a breakout. If the breakout doesn’t happen, we could see a retracement back down to current levels.
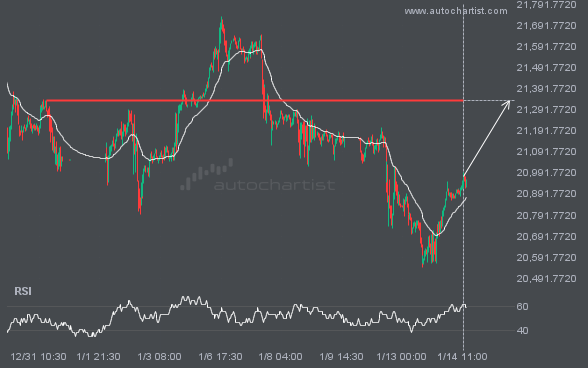
NAS100 is approaching a resistance line at 21333.3320. If it hits the resistance line, it may break through this level to continue the bullish trend, or it may turn around back to current levels.
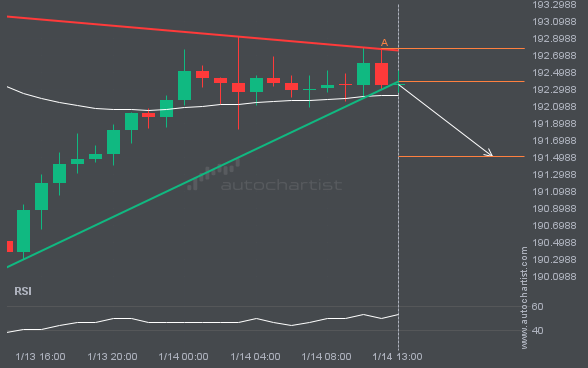
The last 4 1 hour candles on GBPJPY formed a Pennant pattern and broken out through the pattern lines, indicating a possible bearish movement towards the price level of 191.5020.
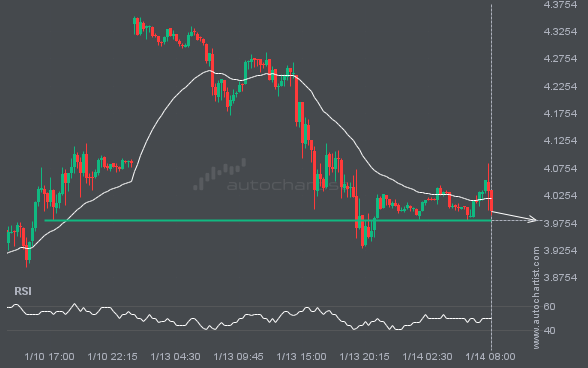
NGC/USD is en route to a very important line that will be a definite deciding factor of what is to come! We may see this trajectory continue to touch and break through 3.9805, unless it runs out of momentum and pulls back to current levels.
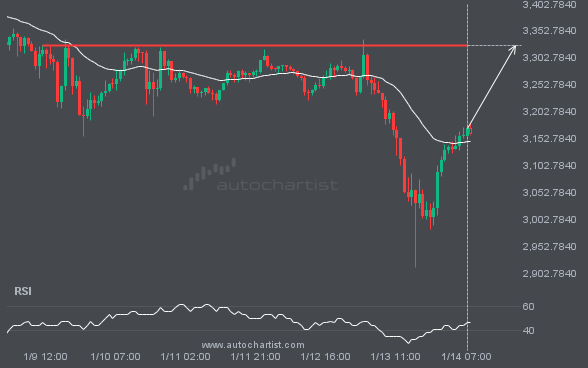
ETHUSD is moving towards a key resistance level at 3325.8999. ETHUSD has previously tested this level 5 times and on each occasion it has bounced back off this level. Is this finally the time it will break through?