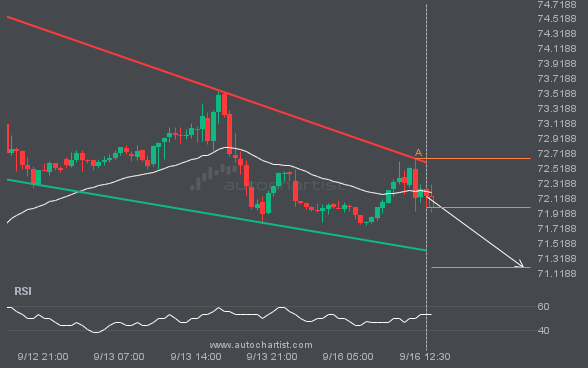
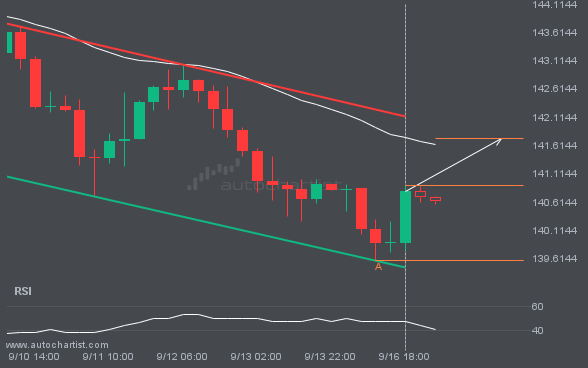
A Falling Wedge pattern was identified on BRN/USD at 72.01, creating an expectation that it may move to the support line at 71.2045. It may break through that line and continue the bearish trend or it may reverse from that line.
 Skip to content
 Home » Market Analysis » After testing the support line numerous times, BRN/USD is once again approaching this line. Can we expect a bearish trend to follow?
A Falling Wedge pattern was identified on BRN/USD at 72.01, creating an expectation that it may move to the support line at 71.2045. It may break through that line and continue the bearish trend or it may reverse from that line.
FTSE100 is moving towards a resistance line. Because we have seen it retrace from this line before, we could see
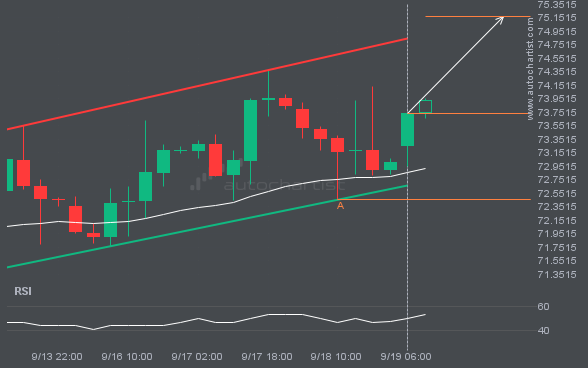
The movement of BRN/USD towards the resistance line of a Flag is yet another test of the line it reached
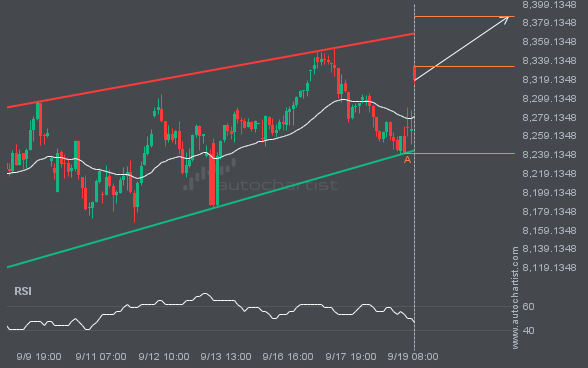
BTCUSD was identified at around 60319.79 having recently rebounded of the support on the 1 hour data interval. Ultimately, the
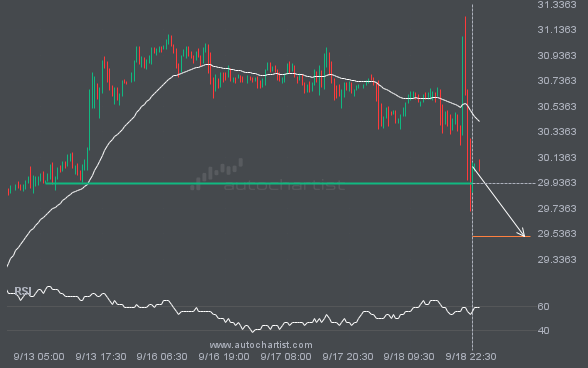
XAGUSD has broken through a support line. It has touched this line numerous times in the last 6 days. This
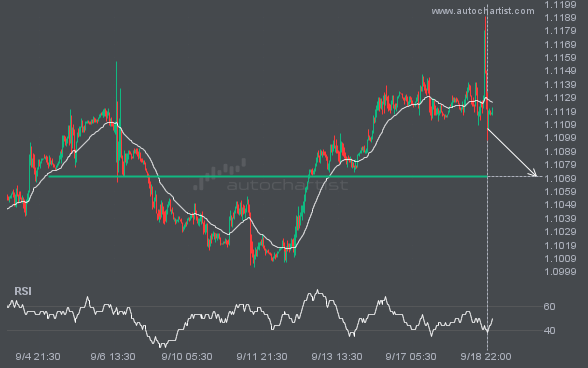
EURUSD is moving towards a support line. Because we have seen it retrace from this level in the past, we
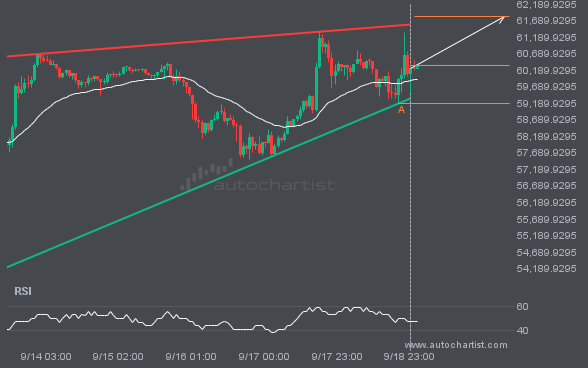
USDJPY is approaching the resistance line of a Channel Down. It has touched this line numerous times in the last
A Falling Wedge pattern was identified on BRN/USD at 72.01, creating an expectation that it may move to the support