Skip to content
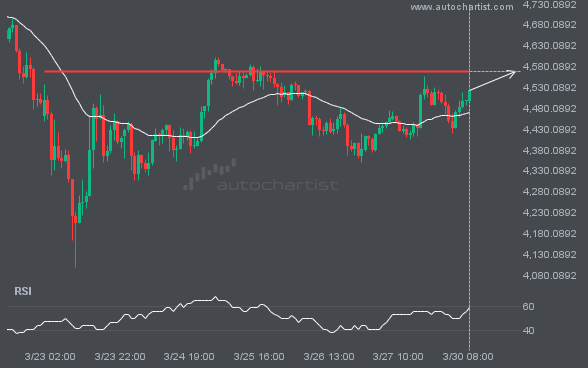
 The movement of XAUUSD towards the 4569.0298 price line is yet another test of a line it has reached numerous times in the past. We can expect this test to occur within the next 2 days, but it is uncertain whether it will result in a breakout through this line or simply rebound to current levels.