Skip to content
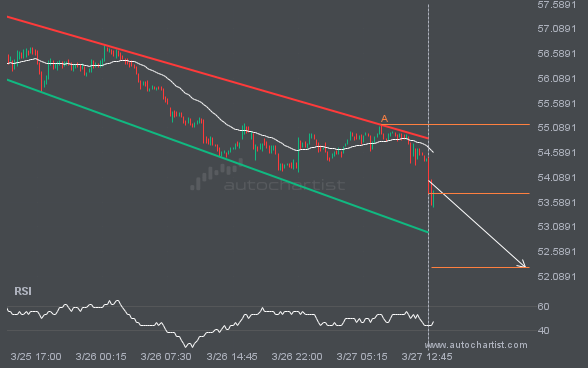
 LTCUSD was identified around 53.77 after recently rebounding off the resistance on the 15 Minutes interval. Ultimately, the stock’s price action has formed a Channel Down pattern. This squeeze may increase the chances of a strong breakout. The projected move could take the price to around 52.2720.