...
MARKET ANALYSIS

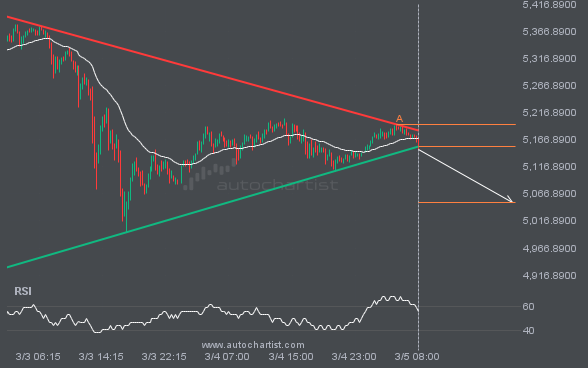
XAUUSD has broken through the support line of a Triangle pattern and suggests a possible move to 5051.3372 within the next 16 hours. It has tested this line before, so it is prudent to wait for confirmation of the breakout before taking action. If the breakout is not confirmed, we could see a retracement back to levels seen over the last 3 days.

GBPJPY has broken through a resistance line. Because it has previously retraced from this price, you should wait for confirmation of the breakout before trading. It has touched this line multiple times over the past 16 days, which suggests a possible target around 216.3907 within the next 3 days.

XAGUSD is trapped in a Falling Wedge formation, implying that a breakout is imminent. This is a strong trade setup for both trend and swing traders. It is now approaching a support line that has been tested before. Divergence watchers may be optimistic about a potential breakout, which could mark the start of a new […]

The movement of S&P500 toward the resistance line of a Channel Up is yet another test of the line it has reached numerous times in the past. This test of the line could occur within the next 2 days, but it is uncertain whether it will result in a breakout through this line or simply […]

XAUUSD is moving toward a support line it has tested many times. It has retraced from this line before, so it’s unclear whether it will break through or rebound again. If XAUUSD continues on its current trajectory, it could reach 4485.0545 within the next 2 days.

LTCUSD has broken through 56.7700, which it has tested many times before. We have also seen it retrace from this level. If this new trend persists, LTCUSD may be heading towards 58.0920 within the next 3 days.

EURUSD is moving toward a support line. Since it has retraced from this line before, we may see either a breakout through this line or a rebound to current levels. It has touched this line numerous times in the last 8 days and may test it again within the next 2 days.

BRN/USD has moved through the support line of a Rising Wedge pattern at 110.23942857142858 on the 4 hour chart. This line has been tested multiple times in the past, and this breakout could signal an upcoming change in the current trend. Price may continue in the current direction toward 106.8749.