...
MARKET ANALYSIS

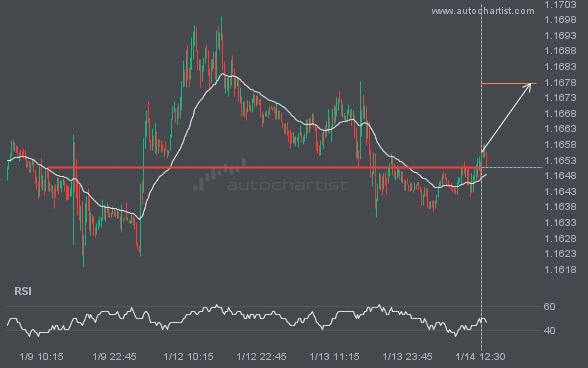
EURUSD has broken through a resistance line. Since it has previously retraced from this price, wait for confirmation of the breakout before trading. It has touched this line several times over the past 6 days. This suggests a possible target around 1.1677 within the next 17 hours.

The movement of USDJPY toward the support line of a Rising Wedge is yet another test of the line it has reached numerous times in the past. This test of the line could occur within the next 2 days, but it is uncertain whether it will result in a breakout through this line or simply […]

NAS100 is heading toward the resistance line of a Ascending Triangle pattern and could reach it within the next 2 days. It has tested this line numerous times before, and this time may be no different, ending in a rebound instead of a breakout. If a breakout doesn’t occur, we could see a retracement back […]

NGC/USD has broken through the support line of a Triangle pattern and suggests a possible move to 3.2426 within the next 6 hours. It has tested this line before, so it is prudent to wait for confirmation of the breakout before taking action. If the breakout is not confirmed, we could see a retracement back […]

ETHUSD is heading toward the resistance line in a Ascending Triangle pattern. If this move continues, the price of ETHUSD could test 2083.3222 within the next 15 hours. It has tested this line many times before, so the move could be short-lived and may rebound as it has before.

XAGUSD is heading toward the support line of a Channel Down pattern and could reach it within the next 6 hours. It has tested this line numerous times before, and this time may be no different, ending in a rebound instead of a breakout. If a breakout doesn’t occur, we could see a retracement back […]

It would be prudent to confirm the breakout that just occurred. Do you consider the move through support significant? Do you have indicators confirming that the price momentum will continue? If so, aim for a target of 53.6635, but consider reducing your position size as the price approaches that target.

An emerging Channel Down pattern in its final wave has been identified on the S&P500 30 Minutes chart. After a strong bullish run, S&P500 is heading toward the upper triangle trendline, with possible resistance at 6792.5563. If the resistance holds, the Channel Down pattern suggests a rebound toward current levels.