...
MARKET ANALYSIS

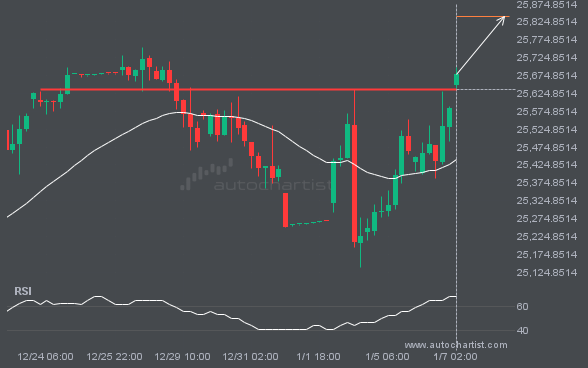
NAS100 has broken through a resistance line. Because it has previously retraced from this price, you should wait for confirmation of the breakout before trading. It has touched this line multiple times over the past 15 days, which suggests a possible target around 25839.7754 within the next 3 days.

LTCUSD is moving toward a support line. Since it has retraced from this line before, we may see either a breakout through it or a rebound to current levels. It has touched this line multiple times in the past 13 days and may test it again within the next 3 days.

FTSE100 is moving toward a support line. Since it has retraced from this line before, we may see either a breakout through it or a rebound to current levels. It has touched this line multiple times in the past 6 days and may test it again within the next 9 hours.

GBPJPY is heading toward the resistance line of a Channel Up pattern and could reach it within the next 10 hours. It has tested this line numerous times before, and this time may be no different, ending in a rebound instead of a breakout. If a breakout doesn’t occur, we could see a retracement back […]

An emerging Triangle pattern in its final wave has been identified on the S&P500 30 Minutes chart. After a strong bullish run, S&P500 is heading toward the upper triangle trendline, with possible resistance at 6719.5129. If the resistance holds, the Triangle pattern suggests a rebound toward current levels.

The movement of XAUUSD toward the support line of a Channel Up is yet another test of the line it has reached numerous times in the past. This test of the line could occur within the next 8 hours, but it is uncertain whether it will result in a breakout through this line or simply […]

ETHUSD showed a long streak of consecutive bullish candles on the Daily chart.