...
MARKET ANALYSIS

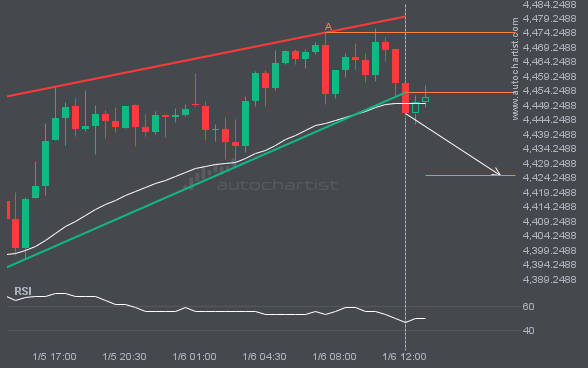
It would be prudent to confirm the breakout that just occurred. Do you consider the move through support significant? Do you have indicators confirming that the price momentum will continue? If so, aim for a target of 4424.8915, but consider reducing your position size as the price approaches that target.

LTCUSD is moving toward a support line. Since it has retraced from this line before, we may see either a breakout through it or a rebound to current levels. It has touched this line multiple times in the past 13 days and may test it again within the next 3 days.

FTSE100 is moving toward a support line. Since it has retraced from this line before, we may see either a breakout through it or a rebound to current levels. It has touched this line multiple times in the past 6 days and may test it again within the next 9 hours.

GBPJPY is heading toward the resistance line of a Channel Up pattern and could reach it within the next 10 hours. It has tested this line numerous times before, and this time may be no different, ending in a rebound instead of a breakout. If a breakout doesn’t occur, we could see a retracement back […]

An emerging Triangle pattern in its final wave has been identified on the S&P500 30 Minutes chart. After a strong bullish run, S&P500 is heading toward the upper triangle trendline, with possible resistance at 6719.5129. If the resistance holds, the Triangle pattern suggests a rebound toward current levels.

The movement of XAUUSD toward the support line of a Channel Up is yet another test of the line it has reached numerous times in the past. This test of the line could occur within the next 8 hours, but it is uncertain whether it will result in a breakout through this line or simply […]

ETHUSD showed a long streak of consecutive bullish candles on the Daily chart.