...
MARKET ANALYSIS

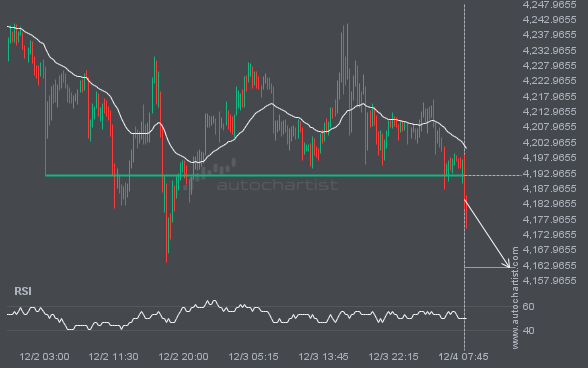
XAUUSD has broken through a level at 4192.1299, suggesting a possible move to 4162.2744 within the next 12 hours. It has tested this level numerous times in the past, so you should wait for confirmation of this breakout before taking any action. If the breakout does not confirm, we could see a retracement back to levels seen over the last 3 days.

BRN/USD is moving toward a resistance line. Because it has retraced from this level in the past, we may see either a breakout through this line or a rebound to current levels. It has touched this line multiple times over the last 10 days and may test it again within the next 2 days.

The last 3 15 Minutes candles on ETHUSD have formed a Triangle pattern and broken out through the pattern lines, indicating a possible bearish movement toward the price level at 2284.8676.

LTCUSD is moving toward a support line. Since it has retraced from this line before, we may see either a breakout through it or a rebound to current levels. It has touched this line multiple times in the past 13 days and may test it again within the next 3 days.

FTSE100 is moving toward a support line. Since it has retraced from this line before, we may see either a breakout through it or a rebound to current levels. It has touched this line multiple times in the past 6 days and may test it again within the next 9 hours.

GBPJPY is heading toward the resistance line of a Channel Up pattern and could reach it within the next 10 hours. It has tested this line numerous times before, and this time may be no different, ending in a rebound instead of a breakout. If a breakout doesn’t occur, we could see a retracement back […]

An emerging Triangle pattern in its final wave has been identified on the S&P500 30 Minutes chart. After a strong bullish run, S&P500 is heading toward the upper triangle trendline, with possible resistance at 6719.5129. If the resistance holds, the Triangle pattern suggests a rebound toward current levels.