Skip to content
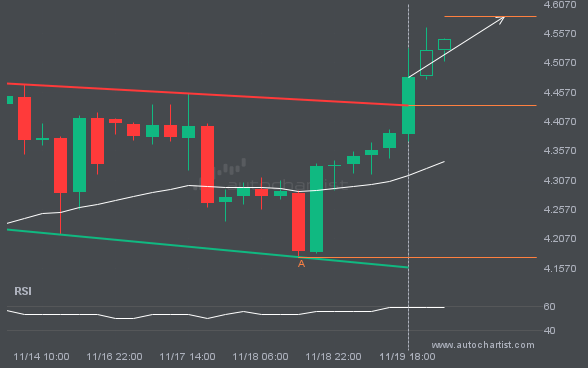
 NGC/USD has moved through the resistance line of a Flag pattern at 4.433833333333334 on the 4 hour chart. This line has been tested multiple times in the past, and this breakout could signal an upcoming change in the current trend. Price may continue in the current direction toward 4.5856.