Skip to content
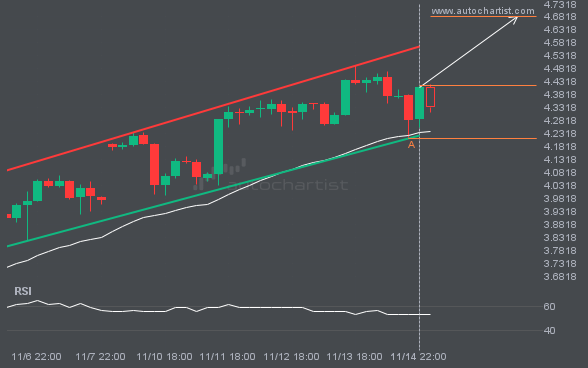
 NGC/USD was identified around 4.4165 after recently rebounding off the support on the 4 hour interval. Ultimately, the stock’s price action has formed a Channel Up pattern. This squeeze may increase the chances of a strong breakout. The projected move could take the price to around 4.6835.