Skip to content
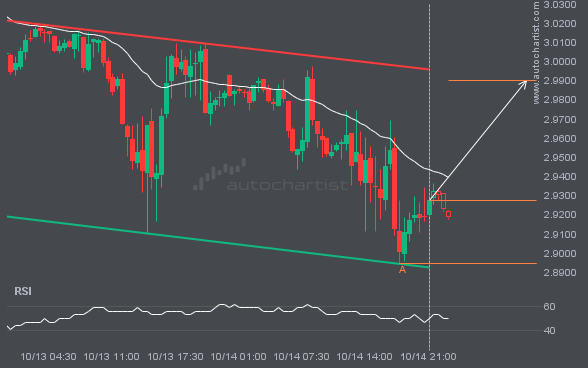
 The movement of NGC/USD towards the resistance line of a Channel Down is yet another test of the line it reached numerous times in the past. This line test could happen in the next 11 hours, but it is uncertain whether it will result in a breakout through this line, or simply rebound back to current levels.