...
MARKET ANALYSIS

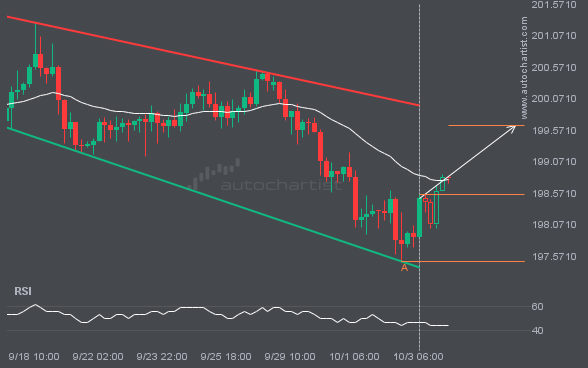
GBPJPY is heading towards the resistance line of a Channel Down. If this movement continues, the price of GBPJPY could test 199.6436 within the next 3 days. It has tested this line numerous times in the past, so this movement could be short-lived and end up rebounding just like it did in the past.

GBPJPY is moving toward a resistance line. Since it has retraced from this line before, we may see either a breakout through this line or a rebound to current levels. It has touched this line numerous times in the last 6 days and may test it again within the next 8 hours.

XAUUSD is moving toward a key support level at 4751.1050. This level has been tested before for XAUUSD. This may present a good trading opportunity either at the spot price or after a breakout through this level.

An emerging Rising Wedge has been detected on LTCUSD. The pattern has not yet broken through support, but the price is expected to move up over the next few hours. At the time the pattern was found, the price was 54.75, and it is expected to move to 55.4495.

S&P500 is heading toward the resistance line of a Channel Up pattern and could reach it within the next 3 days. It has tested this line numerous times before, and this time may be no different, ending in a rebound instead of a breakout. If a breakout doesn’t occur, we could see a retracement back […]

USDJPY was identified around 159.0765 after recently rebounding off the resistance on the 4 hour interval. Ultimately, the stock’s price action has formed a Channel Down pattern. This squeeze may increase the chances of a strong breakout. The projected move could take the price to around 157.4746.

NGC/USD is moving toward a resistance line. Since it has retraced from this line before, we may see either a breakout through it or a rebound to current levels. It has touched this line multiple times in the past 20 days and may test it again within the next 3 days.