Skip to content
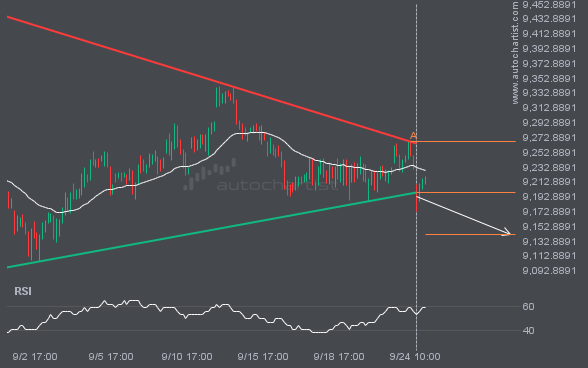
 FTSE100 moved through the support line of a Triangle at 9198.297435897435 on the 1 hour chart. This line has been tested a number of times in the past and this breakout could mean an upcoming change from the current trend. It may continue in its current direction toward 9142.1978.