...
MARKET ANALYSIS

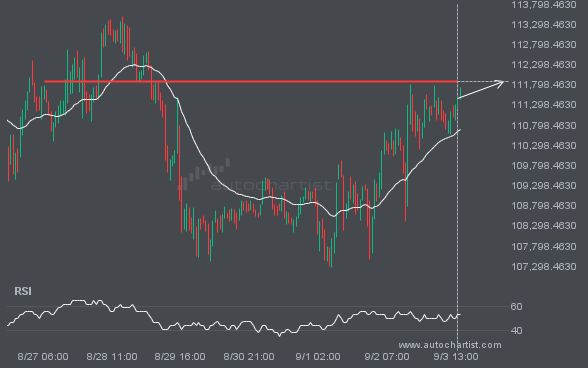
BTCUSD is about to retest a key horizontal resistance level near 111880.6797. It has tested this level 3 times in the recent past and could simply bounce off like it did last time. However, after this many tries, maybe it’s ready to start a new trend.

EURUSD is moving toward a support line. Because it has retraced from this level in the past, we may see either a breakout through this line or a rebound to current levels. It has touched this line multiple times over the last 3 days and may test it again within the next 10 hours.

S&P500 is moving toward a support line. Since it has retraced from this line before, we may see either a breakout through this line or a rebound to current levels. It has touched this line numerous times in the last 16 days and may test it again within the next 3 days.

A Falling Wedge pattern was identified for NGC/USD at 2.8995, suggesting it may move toward the support line at 2.8510. It may break through that line and continue the bearish trend, or reverse from it.

XAGUSD is approaching a support line at 86.7077. If it hits the support line, it may break through this level to continue the bearish trend, or it may return to current levels.

BTCUSD has moved higher by 6.44% from 64904.06 to 69080.89 in the last 15 hours.

FTSE100 is moving toward a resistance line it has tested many times. It has retraced from this line before, so it’s unclear whether it will break through or rebound again. If FTSE100 continues on its current trajectory, it could reach 10967.5713 within the next 2 days.

An emerging Rising Wedge pattern in its final wave has been identified on the USDJPY 1 hour chart. After a strong bullish run, USDJPY is heading toward the upper triangle trendline, with possible resistance at 156.8224. If the resistance holds, the Rising Wedge pattern suggests a rebound toward current levels.