...
MARKET ANALYSIS

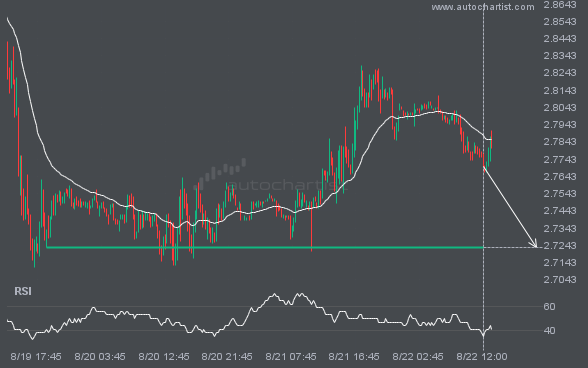
NGC/USD is heading towards a line of 2.7230. If this movement continues, the price of NGC/USD could test 2.7230 within the next 14 hours. But don’t be so quick to trade, it has tested this line numerous times in the past, so this movement could be short-lived and end up rebounding.

S&P500 is moving towards a resistance line which it has tested numerous times in the past. We have seen it retrace from this line before, so at this stage it isn’t clear whether it will breach this line or rebound as it did before. If S&P500 continues in its current trajectory, we could see it […]

Rare candle sequence recorded on the USDJPY Daily chart, ending at 154.2120.

LTCUSD is moving towards a support line. Because we have seen it retrace from this line before, we could see either a break through this line, or a rebound back to current levels. It has touched this line numerous times in the last 2 days and may test it again within the next 11 hours.

NAS100 has broken through a support line. Because we have seen it retrace from this price in the past, one should wait for confirmation of the breakout before trading. It has touched this line numerous times in the last 8 days and suggests a possible target level to be around 25550.7305 within the next 2 […]

NGC/USD is moving towards a key support level at 3.7795. This is a previously tested level for NGC/USD. This could be a good trading opportunity, either at the spot price, or after breaching this level.

Emerging Rising Wedge detected on BRN/USD – the pattern is an emerging one and has not yet broken through support, but the price is expected to move up over the next few hours. The price at the time the pattern was found was 65.6865 and it is expected to move to 66.1253.

EURUSD is moving towards a support line. Because we have seen it retrace from this line before, we could see either a break through this line, or a rebound back to current levels. It has touched this line numerous times in the last 6 days and may test it again within the next 19 hours.