Skip to content
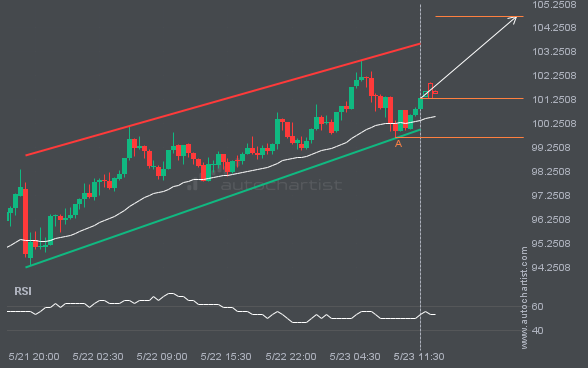
 LTCUSD is moving towards a resistance line which it has tested numerous times in the past. We have seen it retrace from this line before, so at this stage it isn’t clear whether it will breach this line or rebound as it did before. If LTCUSD continues in its current trajectory, we could see it reach 104.7264 within the next 11 hours.