...
MARKET ANALYSIS

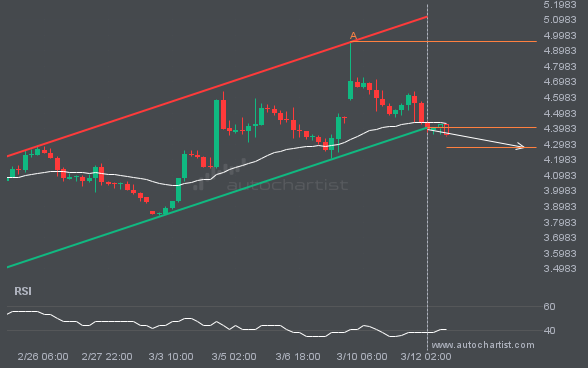
NGC/USD has broken through a support line of a Channel Up chart pattern. If this breakout holds true, we may see the price of NGC/USD testing 4.2802 within the next 3 days. But don’t be so quick to trade, it has tested this line in the past, so you should confirm the breakout before taking any action.

XAUUSD is moving toward a support line. Since it has retraced from this line before, we may see either a breakout through it or a rebound to current levels. It has touched this line multiple times in the past 18 days and may test it again within the next 3 days.

A rare candlestick sequence was recorded on the ETHUSD Daily chart, ending at 2346.6900.

S&P500 has broken through a line at 7214.6802. If this breakout holds, we could see the price of S&P500 move toward 7178.7388 within the next 7 hours. However, don’t be too quick to trade. It has tested this line many times in the past, so confirm the breakout before placing any trades.

NGC/USD has broken through a line at 2.7365. If this breakout holds, we could see the price of NGC/USD move toward 2.7796 within the next 3 days. However, don’t be too quick to trade. It has tested this line many times in the past, so confirm the breakout before placing any trades.

Triangle pattern identified on GBPJPY has broken through a support level, with price momentum continuing to move downward. This presents a solid trading opportunity, with the price expected to reach 211.4635 in the next 11.

This trade setup on NAS100 formed after a period of consolidation, during which the price moved mostly sideways before choosing a longer-term direction. Following the bearish breakout through support, the price could move toward 27703.0311.

BTCUSD has breached the resistance line at 79117.3828. It may continue the bullish trend toward 80796.3984, or it may be yet another test of this level.