...
MARKET ANALYSIS

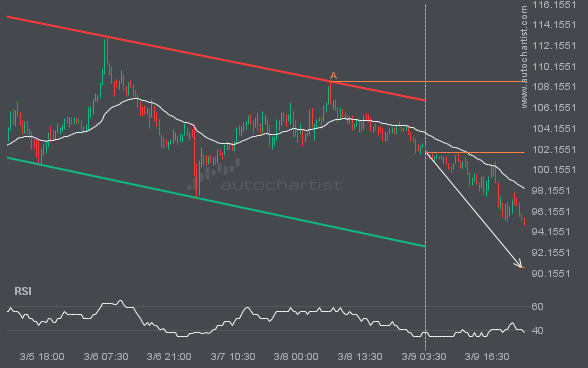
LTCUSD was identified at around 101.83 having recently rebounded of the resistance on the 30 Minutes data interval. Ultimately, the price action of the stock has formed a Channel Down pattern. This squeeze may increases the chances of a strong breakout. The projected movement will potentially take the price to around the 90.7303 level.

FTSE100 has moved higher by 14.44% from 7677.0 to 8785.56 in the last 52 days.

NAS100 has broken through a line of 21279.5000 and suggests a possible movement to 21529.6035 within the next 11 hours. It has tested this line numerous times in the past, so one should wait for a confirmation of this breakout before taking any action. If the breakout doesn’t confirm, we could see a retracement back […]

The breakout of S&P500 through the resistance line of a Ascending Triangle could be a sign of the road ahead. If this breakout persists, we may see the price of S&P500 testing 5923.8800 within the next 16 hours.

This trade setup on USDJPY is formed by a period of consolidation; a period in which the price primarily moves sideways before choosing a new direction for the longer term. Because of the bullish breakout through resistance, it seems to suggest that we could see the next price move to 144.6464.

The last 8 4 hour candles on XAUUSD formed a Rising Wedge pattern and broken out through the pattern lines, indicating a possible bearish movement towards the price level of 3304.9676.

The breakout of GBPJPY through the 194.0700 price line is a breach of an important psychological price that is has tested numerous in the past. If this breakout persists, GBPJPY could test 194.8174 within the next 2 days. One should always be cautious before placing a trade, wait for confirmation of the breakout.

BTCUSD is approaching the resistance line of a Channel Up. It has touched this line numerous times in the last 4 days. If it tests this line again, it should do so in the next 19 hours.