 Skip to content
 You can read the entire case study here to learn more about the impact. Integrating Autochartist’s advanced technical analysis within SparkMarkets’ platform
You would be well advised to confirm the breakout that has just occurred – do you believe the move through
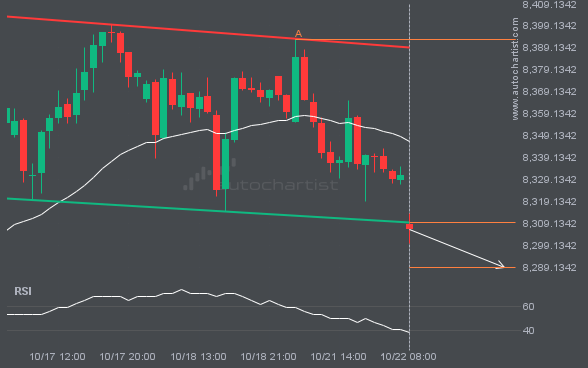
Descending Triangle pattern identified on FTSE100 has broken through a support level with the price momentum continuing to move in
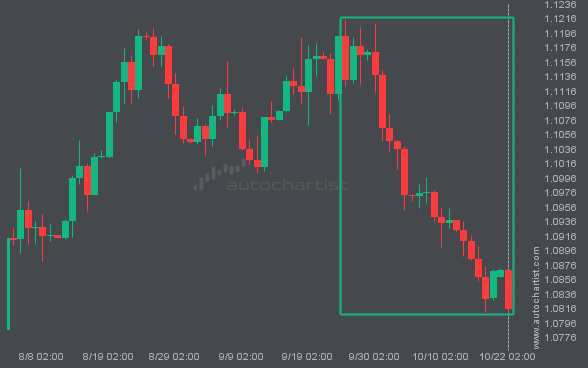
EURUSD has moved lower by 2.82% from 1.11299 to 1.08155 in the last 28 days.
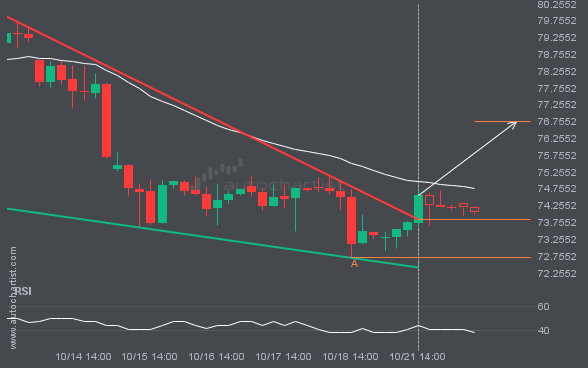
The breakout of BRN/USD through the resistance line of a Falling Wedge could be a sign of the road ahead.

Mobile trading apps have literally put financial markets in the palm of our hands. They have made it easier than
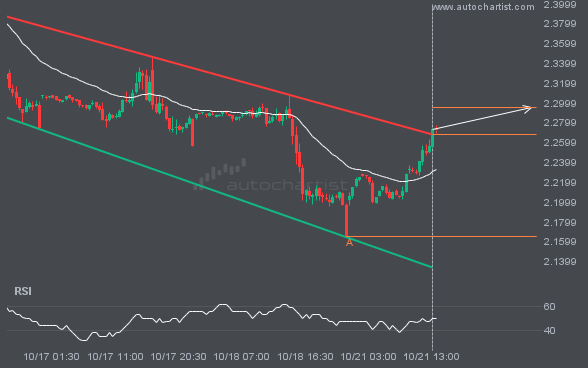
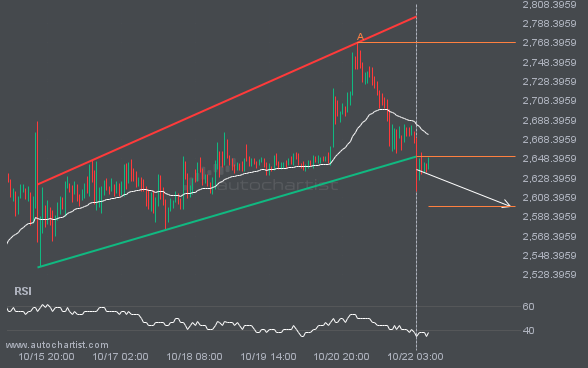
NGC/USD moved through the resistance line of a Channel Down at 2.268646341463415 on the 30 Minutes chart. This line has
Autochartist provides an extensive analytics toolset with features to take your trading to the next level. Empower your day-to-day trading decisions with an unrivalled breadth and depth of analysis driven by advanced algorithms, powerful big-data technology, and user-friendly trading tools.

