 Skip to content
 EURUSD hits 1.09089 after a 1.99% move spanning 21 days.
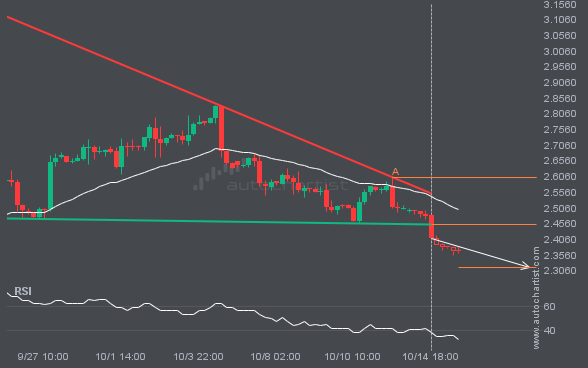
NGC/USD has broken through a support line. It has touched this line at least twice in the last 21 days.

Imagine a time when trading meant frantically dialling your broker on a rotary phone, hoping the market hadn’t moved against
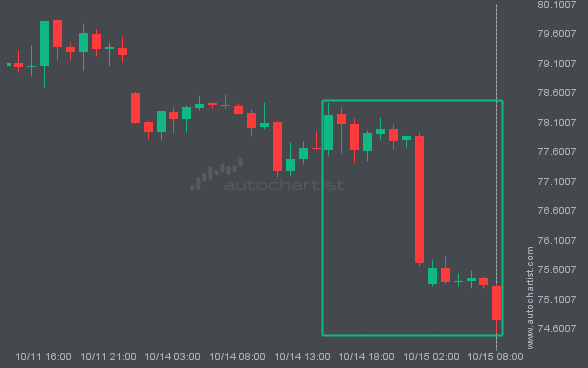
BRN/USD experienced an extremely large move that lasted 17. This movement is in the 5.0 percentile and is uncommon. It
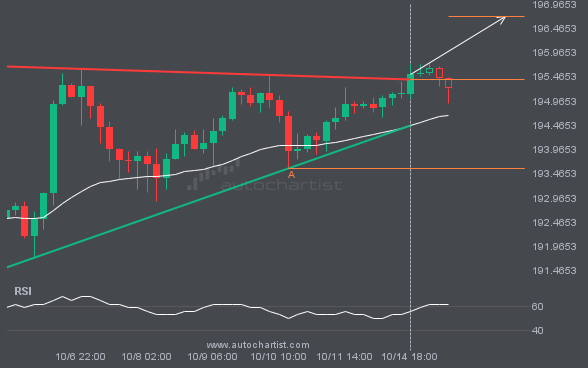
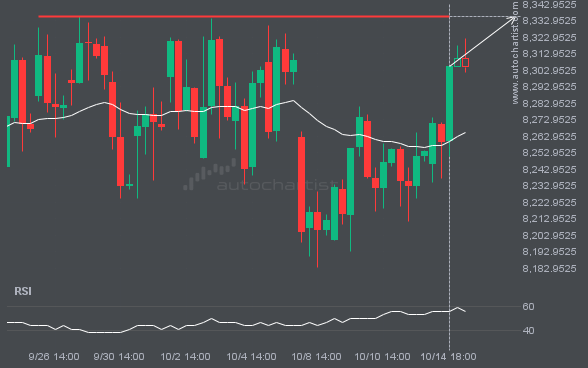
GBPJPY has broken through the resistance line of a Ascending Triangle technical chart pattern. Because we have seen it retrace
BTCUSD is moving towards a support line. Because we have seen it retrace from this line before, we could see
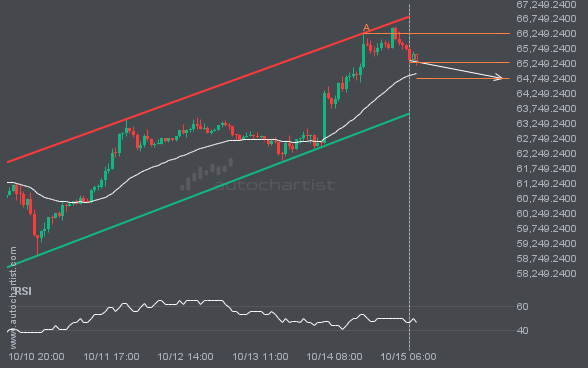
The price of FTSE100 in heading back to the resistance area. It is possible that it will struggle to break
Autochartist provides an extensive analytics toolset with features to take your trading to the next level. Empower your day-to-day trading decisions with an unrivalled breadth and depth of analysis driven by advanced algorithms, powerful big-data technology, and user-friendly trading tools.

