 Skip to content
 USDJPY has broken through a line of 152.0220 and suggests a possible movement to 151.6049 within the next 5 hours.
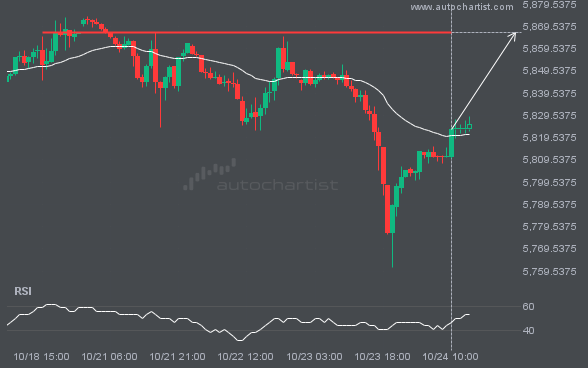
The price of S&P500 in heading back to the resistance area. It is possible that it will struggle to break
NGC/USD has broken through the resistance line of a Triangle technical chart pattern. Because we have seen it retrace from
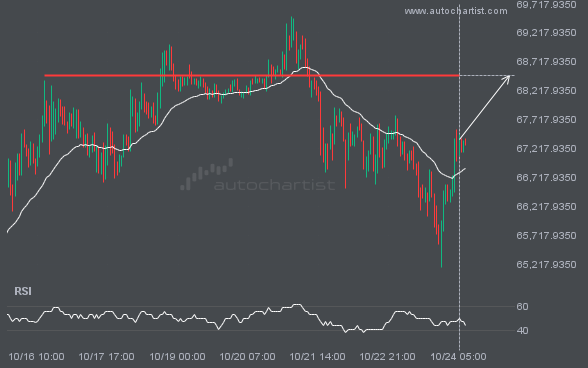
BTCUSD is moving towards a key resistance level at 68483.5781. BTCUSD has previously tested this level 5 times and on

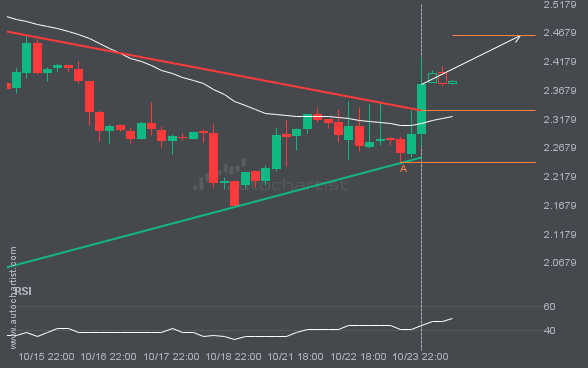
LTCUSD has broken through the resistance line which it has tested twice in the past. We have seen it retrace
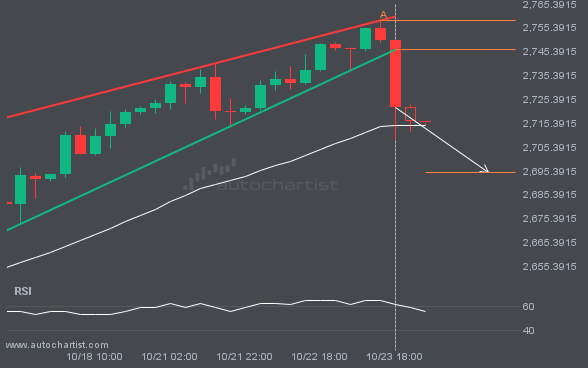
The breakout of XAUUSD through the support line of a Rising Wedge could be a sign of the road ahead.
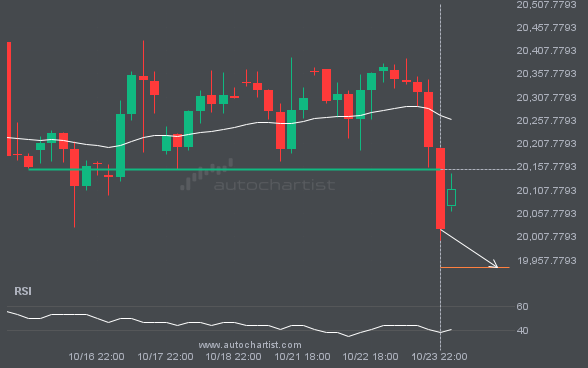
A strong support level has been breached at 20152.5508 on the 4 hour NAS100 chart. Technical Analysis theory forecasts a
Autochartist provides an extensive analytics toolset with features to take your trading to the next level. Empower your day-to-day trading decisions with an unrivalled breadth and depth of analysis driven by advanced algorithms, powerful big-data technology, and user-friendly trading tools.

