Autochartist General
MARKET ANALYSIS

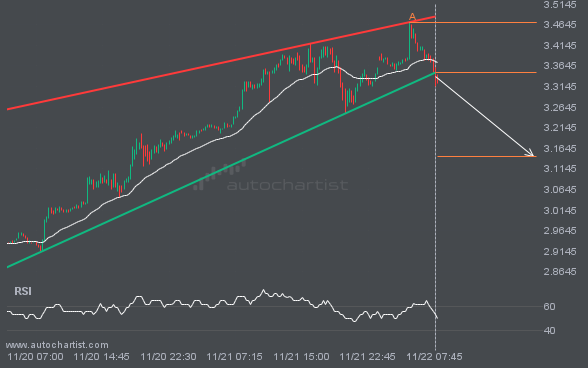
NGC/USD has broken through the support line of a Rising Wedge technical chart pattern. Because we have seen it retrace from this line in the past, one should wait for confirmation of the breakout before taking any action. It has touched this line twice in the last 3 days and suggests a possible target level to be around 3.1441 within the next 15 hours.
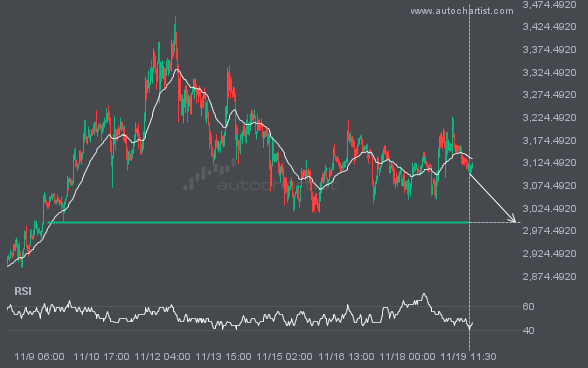
EURUSD is moving towards a key support level at 1.0523. This is a previously tested level for EURUSD. This could

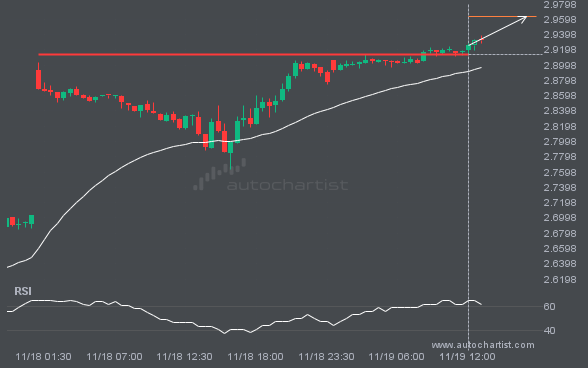
A strong resistance level has been breached at 2.9135 on the 30 Minutes NGC/USD chart. Technical Analysis theory forecasts a

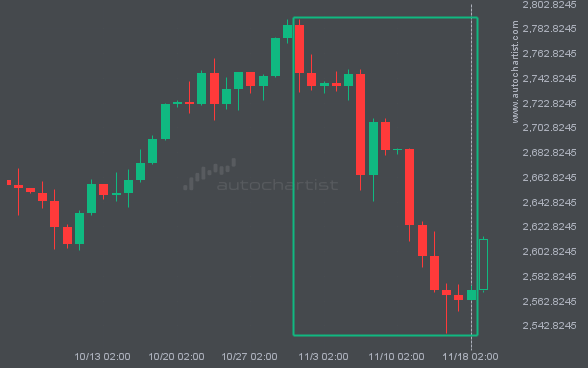
Those of you that are trend followers are probably eagerly watching XAUUSD to see if its latest 6.38% move continues.

BTCUSD rose sharply for 15 days – which is an excessively big movement for this instrument; exceeding the 98% of

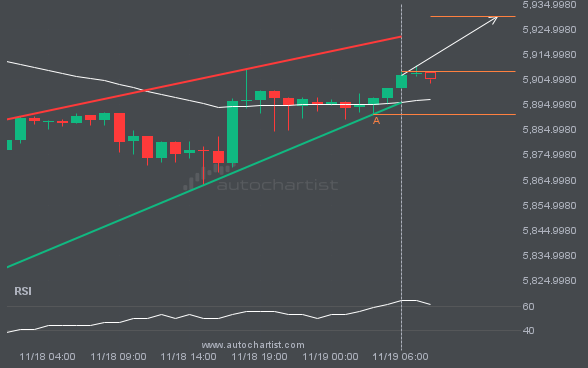
The movement of S&P500 towards the resistance line of a Rising Wedge is yet another test of the line it