Autochartist General
MARKET ANALYSIS

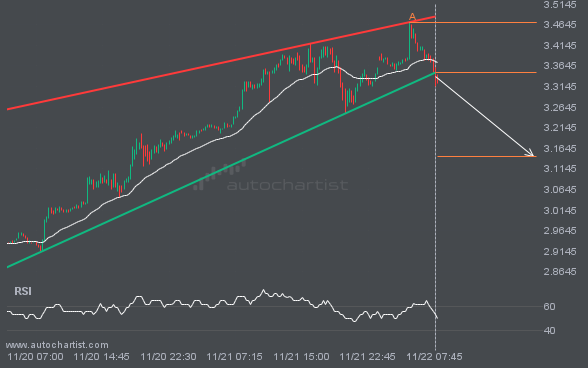
NGC/USD has broken through the support line of a Rising Wedge technical chart pattern. Because we have seen it retrace from this line in the past, one should wait for confirmation of the breakout before taking any action. It has touched this line twice in the last 3 days and suggests a possible target level to be around 3.1441 within the next 15 hours.
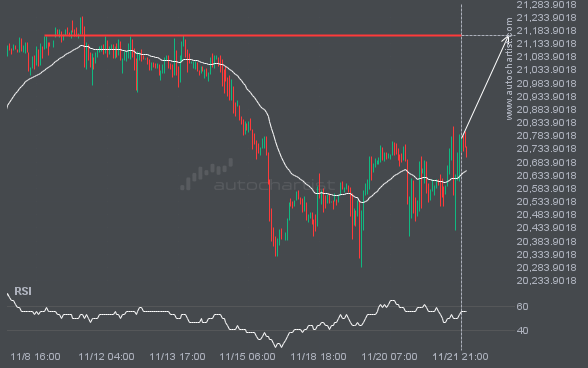
NAS100 is heading towards 21162.8242 and could reach this point within the next 3 days. It has tested this line

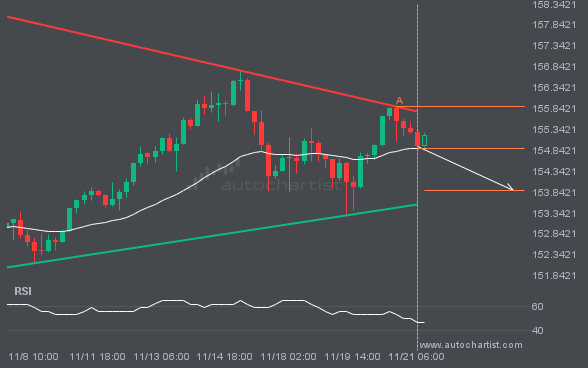
An emerging Triangle has been detected on USDJPY on the 4 hour chart. There is a possible move towards 153.8857

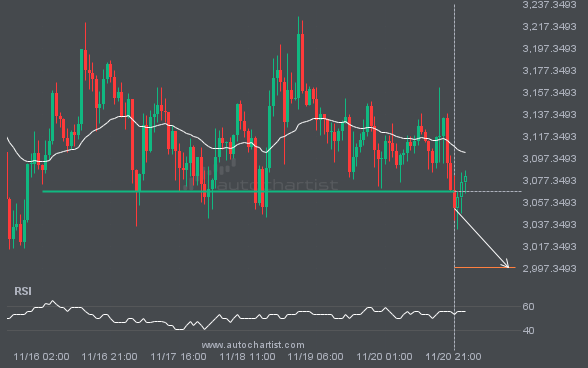
The breakout of ETHUSD through the 3067.3601 price line is a breach of an important psychological price that is has

FTSE100 is heading towards 8148.8799 and could reach this point within the next 3 days. It has tested this line

NGC/USD experienced an extremely large move that lasted 2. This movement is in the 95.0 percentile and is uncommon. It

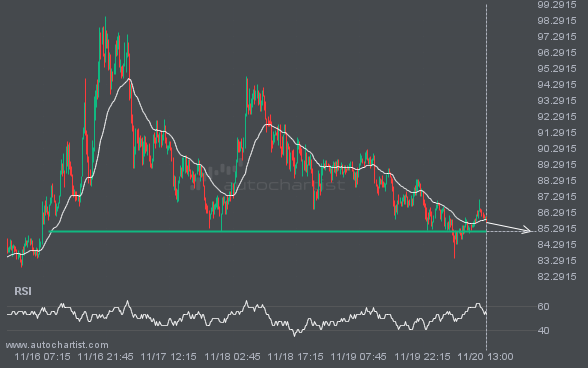
A strong support level has been identified at 85.1100 on the 15 Minutes LTCUSD chart. LTCUSD is likely to test

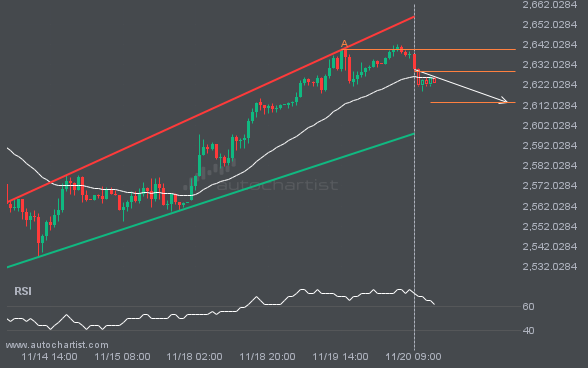
XAUUSD is heading towards the support line of a Channel Up and could reach this point within the next 2